
CAPABILITIES
AI Admin Dashboard: Run Your AI Operation from One Place
AI stops being a collection of tools the day someone becomes accountable for it. The AI admin dashboard is where that accountability gets a console: usage, activity, keys, tool connections, skills, and security in one place.
What an AI admin dashboard is
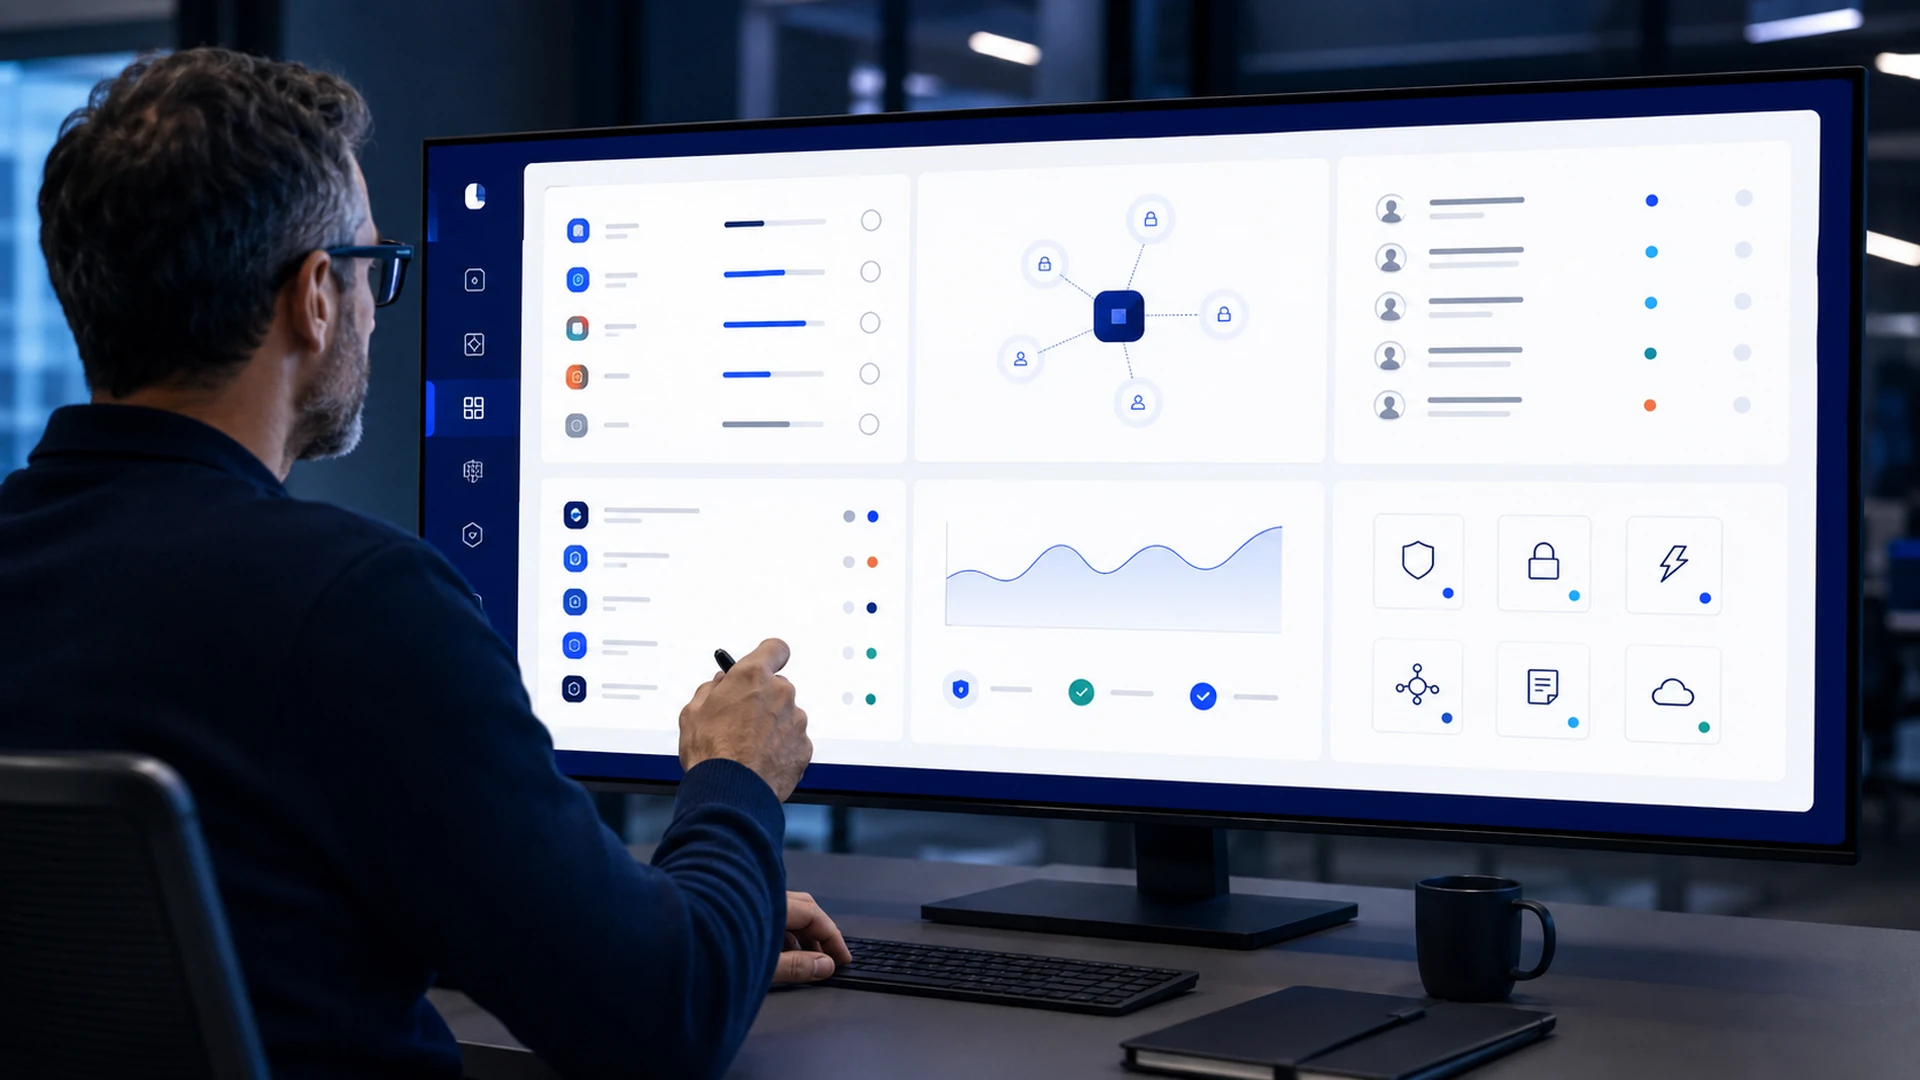
An AI admin dashboard is the operations console for an organization’s AI layer: the single place administrators see usage and activity, manage API keys and MCP servers, oversee skills, and watch tracking and security posture.
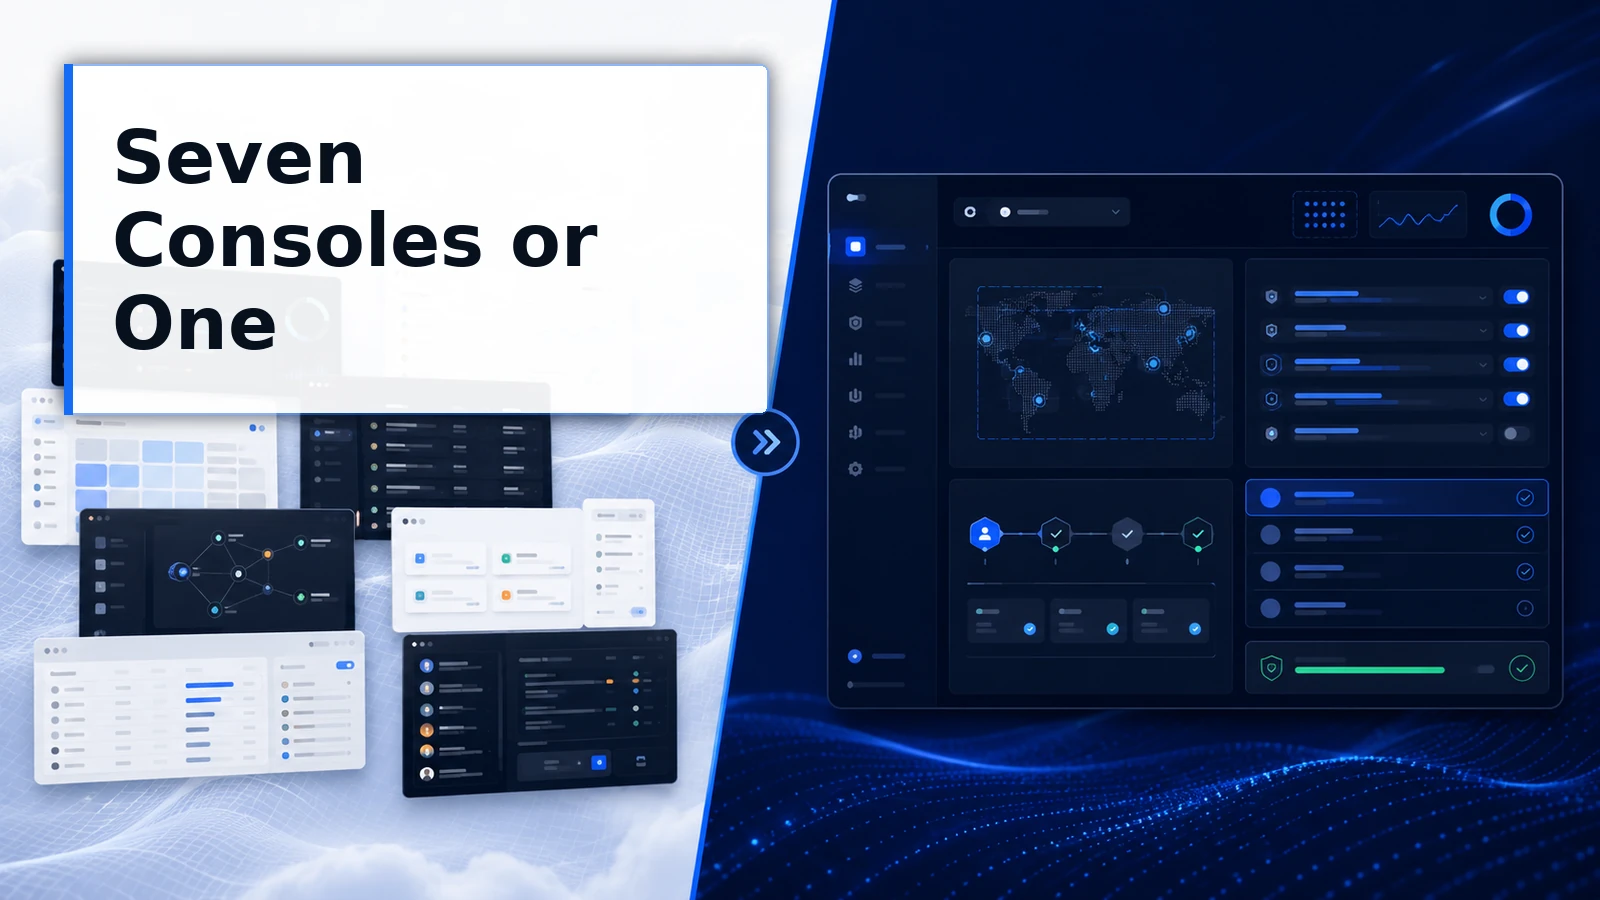
The one-place part is the substance, not the convenience. AI operations fragment by default, one surface per provider, one settings page per tool, and fragmented operations are unmanageable operations. The dashboard is where the pieces become a system someone can actually run.
Somebody has to run this thing
Every organization crosses the same threshold. AI usage grows from experiments into infrastructure, and a question surfaces that nobody assigned: who runs it?
Not who uses it. Who answers for it. Who knows what usage looks like this week, which API keys exist and why, which tool connections reach which systems, which skills teams depend on, and whether anything in the security posture changed.
Where AI grew up as scattered tools, that role is impossible, because the information lives in a dozen vendor consoles that do not agree with each other. The prerequisite for running AI as an operation is an operating layer, and a console that shows all of it.
What one console should show
An AI operations dashboard earns its screen space by answering the questions an administrator actually fields, in one visit.
Usage. Who is using AI, how much, through which models, at what cost, by user, group, and workflow.
Activity. What is happening now and recently, so the operational pulse is observable rather than inferred.
API keys. Which keys exist, what they reach, and who is responsible for each, because unaccounted keys are unaccounted access.
MCP servers. The tool-connection registry: what is connected, who can use it, and what state it is in.
Skills. The governed workflow catalog: what exists, who owns it, and who has access.
Tracking and security. The records and posture questions security teams ask, answerable from the console instead of reconstructed after the fact.
How ThinkFreely implements the dashboard
The admin dashboard is part of the ThinkFreely operating layer, sitting on top of the same governed structures the rest of the platform runs on.
That placement is why it works. Usage views draw on the routing layer’s records, so multi-model traffic lands in one picture.
Key and MCP management operate on the actual registries, not a mirror of them. Skills oversight reflects the real catalog with its real permissions. The dashboard is a console over the operation itself, which is what keeps what you see and what is true from drifting apart.
The scope claim worth stating precisely: the dashboard covers the AI activity that runs through the ThinkFreely layer. It is the console for your governed operation, and one honest argument for consolidating AI work into a governed operation is exactly that a real console becomes possible.
What the dashboard provides
-
Usage and cost views
Consumption and spend are visible by user, group, model, and workflow, so the operational and financial picture live in the same place.
-
Activity oversight
Current and recent activity is observable at the operation level, giving administrators a pulse instead of a support-ticket surprise.
-
API key management
Keys are created, reviewed, and retired from one place, with each key attributable to an owner and a purpose.
-
MCP server administration
The tool-connection registry is managed from the console: registration, testing, permissions, and state, in one governed view.
-
Skills oversight
The governed skill catalog is visible and manageable, with ownership and access clear, so the operation’s workflows have an accountable home.
-
Tracking and security posture
Records and security-relevant settings are reviewable from the same console, supporting the questions audits and security reviews actually ask.
What one console changes for the business
-
An accountable operation
When one console shows the whole layer, “who runs AI here” has an answer, and that answer has the visibility the job requires.
-
Faster answers, fewer meetings
Usage, key, connection, and skill questions get answered from the console in minutes, not assembled across vendor consoles in days.
-
Reviews that pass
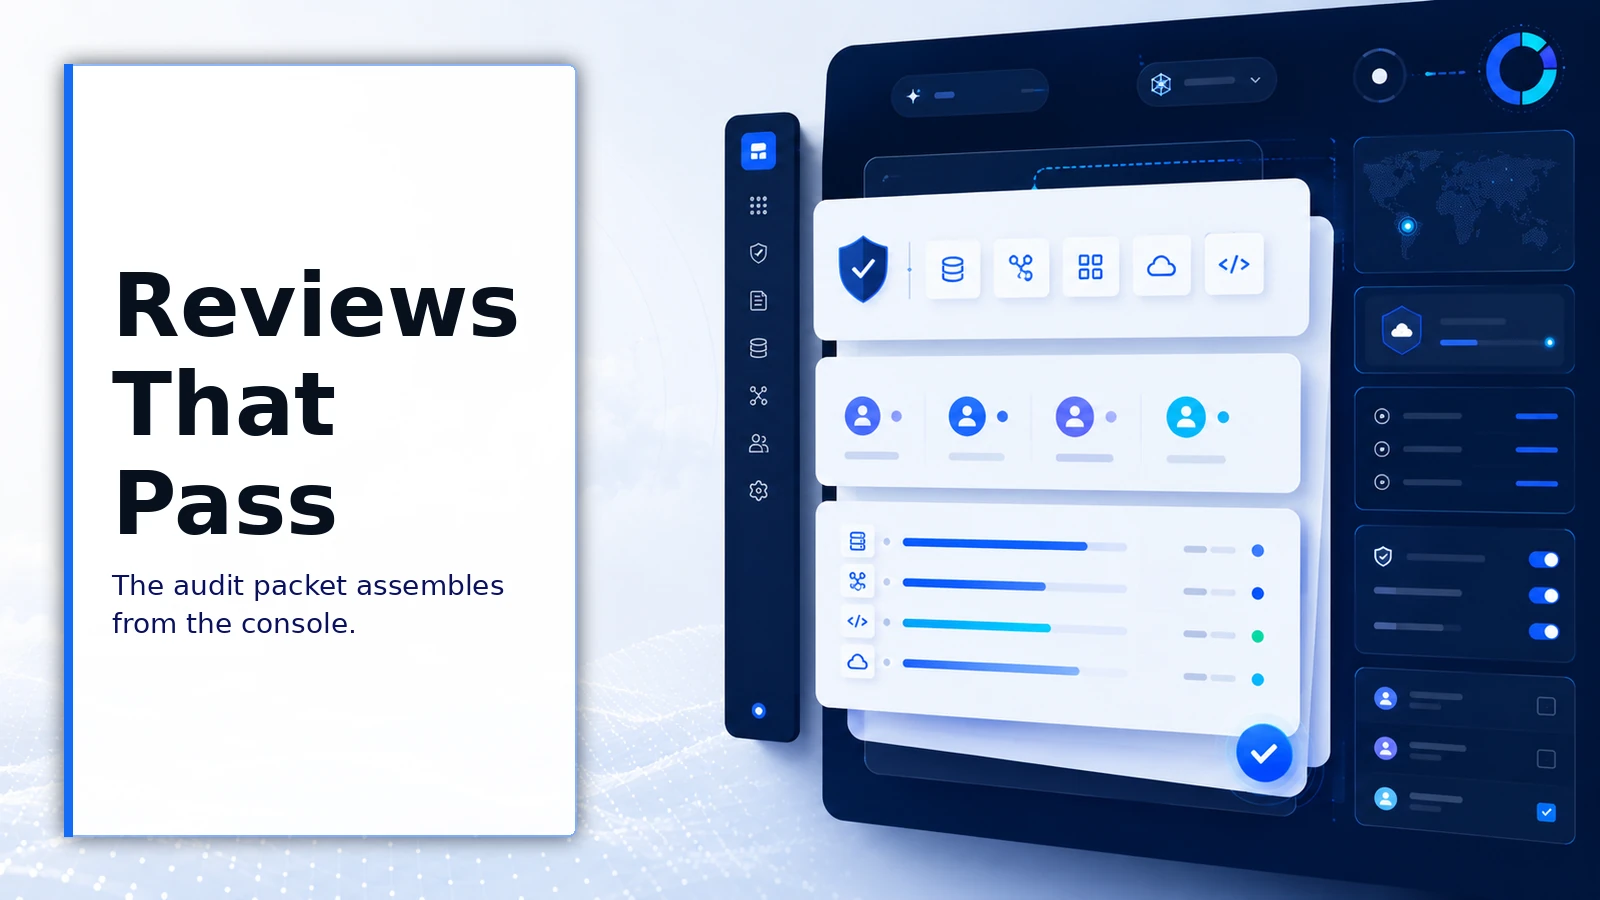
Security and audit reviews meet an inspectable operation with current records, which is the difference between a finding and a formality.

Running the operation well
Questions a working admin cadence answers from the dashboard:
- What changed in usage this period, and does anything need a routing or policy response?
- Are there keys or MCP connections nobody has used in months, and should they exist?
- Which skills carry heavy usage and deserve investment, and which are stale?
- Does current activity match the access model, or has drift crept in?
- What would you want to already know before the next security review asks?
A week with the console, through two owners’ eyes.
An IT platform administrator opens the console Monday morning: usage is up in support, flat elsewhere, one API key is approaching retirement, and a newly requested MCP server is pending permissioning. The whole review takes fifteen minutes because it is one surface, not seven tabs and a spreadsheet.
A security lead preparing a quarterly review pulls the operation’s posture from the dashboard: connections and their permissions, key inventory with owners, and usage records for the period. The review packet assembles from the console instead of from interviews.
What the console stands on
-
Console over real registries
Key, MCP, and skill management operate on the operating layer’s actual structures, so the console reflects the operation rather than a copy of it.
-
Multi-model in one view
Because usage records accumulate at the routing layer, the dashboard shows traffic across providers in a single picture.
-
Operations and security together
Usage, activity, and security-relevant records share one console, so the operational and posture views stop living in different rooms.
Where a dashboard has limits
A console shows the operation. It does not run it for you. Usage anomalies still need investigation, stale keys still need judgment calls, and the review cadence is a human commitment the dashboard supports but cannot supply.
Scope follows governance. Activity outside the governed layer is outside the console, which makes the dashboard an argument for consolidation, not a magic window into shadow usage.
And one console can still be misused as one hammer. The dashboard measures the operation; wielding it as individual surveillance corrodes the trust that keeps people on the governed path. Run the operation, not the inquisition.
Frequently asked questions
Who should own the AI admin dashboard?
Whoever answers for AI operations, commonly an IT platform lead or AI program owner, with security holding review access. The healthiest pattern gives one role operational ownership and a cadence, rather than distributing the console to everyone and the accountability to no one.
How does the dashboard relate to usage visibility?
Usage visibility is the record layer: attributable activity across users, groups, models, endpoints, keys, and workflows. The dashboard is the console where those records meet the management surfaces, keys, MCP servers, skills, and security posture, so seeing and acting happen in the same place. Visibility is the data. The dashboard is the desk.
Can the dashboard manage tool connections directly?
Yes. MCP server administration runs from the console: registration, testing, permissioning by user and group, and state. Managing connections where usage is also visible means access decisions get made next to the evidence.
What makes this different from a provider’s admin panel?
A provider panel shows that provider. An AI operations dashboard sits at your operating layer, above the models, so a multi-provider operation appears as one system: one usage picture, one key inventory, one connection registry. The difference compounds with every provider you add.
What cadence keeps the console useful?
A short weekly review and a deeper monthly one covers most operations. Weekly: usage shifts, pending permission requests, anything anomalous in activity.
Monthly: key and connection inventory, stale skills, and posture items the next security review will ask about. The console makes the cadence cheap. The cadence is what makes the console an operating practice instead of a screen nobody opens.
Give the operation a cockpit
AI became infrastructure. Infrastructure gets an operations console, an owner, and a cadence.
Put yours in one place.